juliana

Page 202

Figure 3–26. Diagram of results of cytophotometric measuring of DNA-amount in 
cells of Scenedesmus acutus treated with bisbenzimide H-33258. 

The asynchronous division is also confirmed by the data of flow
cytometry. Recently this method finds a successful application in studying
the dynamics of quantitative changes of DNA during individual phases of
life cycle in different species of suspensial cell cultures. What is more,
registration of such processes related with cell division is difficult to be
realized by other research methods.
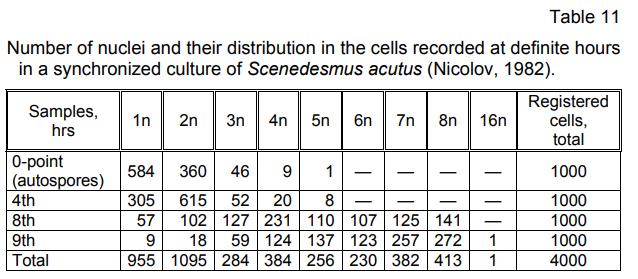
The histograms of a synchronized cell culture of Scenedesmus acutus
(Fig. 3–27, 1—5) outline a fluent, consecutive process of quantitative
changes of DNA at fixed hours of the life cycle, which corresponds to a
consecutive (asynchronous) development and division of the nuclei,
observed on the photoregistered cytological cell pictures. The absence of
clearly expressed peaks only at exactly fixed moments (phases), that would
mark nuclear division in two, four, eight, etc., demonstrates that nuclear
reproduction occurs asynchronously, consecutively, which correlates with
the results obtained using the other research methods.

Page 202 Read More »

Page 201

image

Figure 3–25. Electron micrograph of a cell with five nuclei in
Scenedesmus acutus (Nicolov et al., 1986).

There was performed a cytophotometric measuring of the amount of
DNA by recording the luminescent intensity of DNA-bounded bisbenzimide H-
33258. Fourteen trinuclear cells (3n) were subjected to photometry
individually. After statistical proceeding of the results the cells are distributed
in three groups (I, II, III) by ascending value. The data of this study expressed
in relative units are given diagrammatically (Fig. 3–26). As seen from the
diagram the nuclei of group III demonstrate higher, almost double DNA
quantity (18.22) than that of group I (9.58). The nuclei of group II are much
more closer to group I (11.22:9.58), than to those of group III (11.22:18.22).
These results give grounds to accept that in the presence of three nuclei in
one cell, one of them is in a more advanced phase of development than the
other two, which differ less in DNA-amount and most probably are in earlier
phases of preparation for division.

Page 201 Read More »

Page 200

Figure 3–24. Scheme of synchronous (A) and asynchronous (B) nuclear 
and cell division (Nicolov, 1993). 
The established asynchronous division of nuclei and cells shown by 
cytological pictures in Figures 3–18—3–23 was also confirmed by other 
research methods. I shall dwell on some of them briefly. 
In a synchronized cell culture of Scenedesmus acutus the dynamics of 
increasing the number of nuclei in one cell cycle was studied. As seen from 
the data in Table 11, in the cells there are registered as even number of 
nuclei — 2, 4, 8 and 16, as well as uneven number — 3, 5 and 7.

The presence of five nuclei in one cell with obviously great differences
in their sizes (Fig. 3–25) is a proof in favour of their asynchronous
reproduction. The presented electron micrograph shows average results of
a number of consecutive cuts, beginning with the top of nuclei and ending
with their bottom.

Page 200 Read More »

Page 199

image

Figure 3–23. Cell coenobia of Chlorella vulgaris. x 800 (Nicolov, 1990). 
a — 2-cell coenobium; b — 3-cell coenobium; c — 4-cell coenobium; d — 5-
cell coenobium; e — 6-cell coenobium; f — 7-cell coenobium; g — 8-cell 
coenobium; h — 9-cell coenobium; i — 11-cell coenobium; j — 15-cell 
coenobium; k — 16-cell coenobium; l — two cells in the course of copulation

image

Page 199 Read More »

Page 198

image

Figure 3–21. Cell coenobia of Scenedesmus acutus. x 800 (Nicolov, 
1990). 
a — 2-cell coenobium; b — 3-cell coenobium; c — 4-cell coenobium; d — 5-
cell coenobium; e — 6-cell coenobium; f — 7-cell coenobium; g — 8-cell 
coenobium; h — 15-cell coenobium; i — 16-cell coenobium.

image

Figure 3–22. Cell coenobia of Scenedesmus acuminatus. x 800 (Nicolov, 
1990). 
a — 3-cell coenobium; b — 4-cell coenobium; c — 5-cell coenobium; d — 6-
cell coenobium; e — 7-cell coenobium; f — 8-cell coenobium. 

Page 198 Read More »

Page 197

image

Figure 3–19. Nuclei in cells of Chlorella vulgaris stained with thionine.
x 1600 (Nicolov, 1991). 
a — cell with one nucleus; b — cell with two nuclei; c — cell with three 
nuclei; d — cell with four nuclei ;e — cell with five nuclei; f — cell with six 
nuclei; g — cell with more nuclei.

image

Figure 3–20. Nuclei in cells of Scenedesmus acutus stained with 
bisbenzimide H-33258. x 1600 (Nicolov and Tchacarof, 1984). 
a — cell with one nucleus; b — cell with two nuclei; c — cell with three 
nuclei; d — cell with four nuclei; e — cell with five nuclei; f — cell with six 
nuclei; g — cell with seven nuclei; h — cell with eight nuclei; i — 4-cell
coenobium; j —cells treated with DNase, at that no nuclear structures are 
observed.

Page 197 Read More »

Page 196

registered in the obtained coenobia (Figs. 3–21—3–23), which represent the
number of cells in one generation. These results do not conform to the basic
rule of the proposition about synchronous division requiring rate frequency of
two (2ⁿ). The differences between synchronous and asynchronous nuclear
and cell division is shown in Figure 3–24.

image

Figure 3–18. Nuclei in cells of Scenedesmus acutus stained with 
thionine. x 1600 (Nicolov, 1982). 
a — two daughter cells (autospores), part of a cell coenobium; b — cell with one 
nucleus; c — cell with one dividing nucleus; d — cell with two nuclei; e — cell 
with two dividing nuclei; f — cell with three nuclei; g — cell with four nuclei; h — 
cell with five nuclei; i — cell with six nuclei; j — cell with seven nuclei; k — cell 
with eight nuclei; l — cell with sixteen nuclei; m — compact 4-cell coenobium; n 
— 4-cell coenobium in the course of releasing the daughter cells; o — compact 
8-cell coenobium; p — cells treated with DNase, at that no nuclear structures are 
observed.

Page 196 Read More »

Page 195

HeLa-cells, etc. In these cells the cell division is realized according to other
“rules”, differing from the normal ones. The reasons for that are complex,
most of them are not clearly explained. Reasonably, these cases can be
considered abnormal or pathological.

image

image

Figure 3–17. Nuclear division in the dinoflagellate alga Gyrodinium 
cohnii (A) and a model of tridimensional reconstruction of the nucleus 
(B). (After Kubai and Ris, 1969). 
mt — microtubules; 1, 2 — chromosomes in contact with the nuclear 
envelope; Cy — nuclear remains; Cp — polar end.

The key to elucidating the cell division as a process lies in revealing the mode
of realization the nuclear reproduction and the chronology of forming daughter cells
in the mother cell. In biology the prevailing concept is that the division of the nuclei
and cells occurs synchronously, through realizing several consecutive cycles of
nuclear divisions. As a result of them there are formed new nuclei and daughter
cells, at that their number always is divisible by two (2ⁿ), where n means number of
division cycles. The concept of universality of the synchronous division has been
expressed concisely in the supposition of Koller (1947) that “synchrony is a constant
rule for all cells” (cited by Ghosh et al., 1978).
Investigations on unicellular green algae of Scenedesmus and Chlorella
genera (Nicolov, and Nicolov et al., 1982—1997 a) show that nuclear and cell
reproduction is realized asynchronously. Reasons for such conclusion are the
uneven number of nuclei (Figs. 3–18—3–20) and daughter cells (autospores)

Page 195 Read More »

Page 194

imaage

Figure 3-16. Isolated metaphase spindles by using different methods 
of light microscopy (After Salmon and Segall, 1980). 
a — differential-interference-contrast microscopy; b — phase-contarst 
microscopy; c — polarized-light microscopy.

In lower eukaryotic organisms — unicellular green algae,
dinoflagellates, euglenes, paramecia, fungi, etc., which possess nuclear
envelope but do not form typical division spindle, cell division is realized by
modes and mechanisms different from the typical mitotic division. As far as
evolution has kept intermediate stages between complete absence and
well-formed mitotic spindle, the obtained results of the investigations in this
field are very diverse. Kubai and Ris (1969) have registered nuclear
division in dinoflagellate alga Girodinium cohnii, where it is seen that its
division is realized by means of the formed synaptonemal complex, through
which the chromosomes just “tear” and are distributed in the two new
daughter nuclei (Fig. 3–17 A). The authors have also successfully
constructed models of tridimensional reconstruction of the nucleus in the
process of division (Fig. 3–17 B). The mode of division described by them
illustrates a nuclear reproduction in case of closed mitosis with internal
division spindle (see Dodge and Vickerman, 1980) or a mechanism with a
scanty information about it. Reasonably they have called it “a new type of
nuclear reproduction”.
As it was already mentioned, normally the cells have one nucleus and
divide in two. This can be accepted as “ideal” model of cell reproduction.
But living nature has not stopped up to here, i.e. to divide the cells only in
two. In their vast majority, especially when they exist as unicellular
organisms, the division is in more than two. Division in two is widely spread
in specialized and differentiated cells, which build the tissues and organs of
multicellular organisms. Depending on that, how many daughter cells will
be obtained, so many nuclei will be formed in the mother cell.
There exist also multicellular cells with disturbed cell cycle — the
symplasts in cross-furrowed muscle fibres, osteoclasts of bone tissue,

Page 194 Read More »

Page 193

the division spindle. But, in many organisms it is formed in absence of
centrioles. Besides, it was established that if in animal cells the centrioles are
destroyed by laser rays, the division spindle continues its normal function.
That means that centrioles are not the structures assembling the microtubules
in a spindle. For that reason now the attention is directed to the two mitotic
centres, which under electron microscope look like shapely, weakly coloured
areas of amorphous material. It is possible replicated centrioles to have been
included additionally in the evolutionary process of animal cells by handing
down to the daughter cells in the course of division.

image

Figure 3–15. A scheme of meiosis and its comparison with usual mitosis. 
For clarity, only one pair of homologous chromosomes is shown (After 
Alberts et al., 1986).

Page 193 Read More »